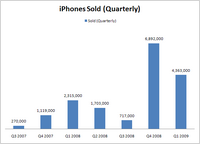
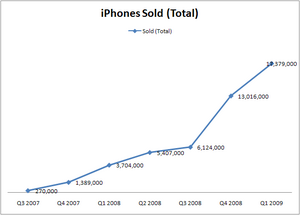
When searching for information on historical iPhone sales earlier today I was shocked to discover that no one had simply tabulated quarterly and cumulative sales of the iPhone. I found a few posts related to the rise in Safari traffic on websites and some information for the first few quarters but little for Apple’s Fiscal 2008.
So, for those interested, here you go!
| Fiscal Quarter | Sold (Quarterly) | Sold (Total) |
|---|---|---|
| Q3 2007 | 270,000 | 270,000 |
| Q4 2007 | 1,119,000 | 1,389,000 |
| Q1 2008 | 2,315,000 | 3,704,000 |
| Q2 2008 | 1,703,000 | 5,407,000 |
| Q3 2008 | 717,000 | 6,124,000 |
| Q4 2008 | 6,892,000 | 13,016,000 |
| Q1 2009 | 4,363,000 | 17,379,000 |


Hey Todd, well presented. Can you quote your source?
Interesting figures- if there have been 1 billion downloads from the app store then the average iphone has more than 50 apps… Doesn’t sound right somehow!?
Judd, these numbers are all straight from Apple’s own 10-Q filings. I’m updating the charts to include their fiscal Q2 (ended March 28).
I suspect they’ll have crossed 25 million units by the end of this quarter and we’ll get an announcement of that at WWDC in a few more weeks.
Pingback: The iPad, and what it means for Flash | Mukul Seth
This is all very confusing.